Joshua Anani
Coated antifouling test panels imaged underwater

Automating marine biofouling assessment

From cameras in the water to a measured result. I build and operate the imaging and data systems that replace manual inspection with consistent, repeatable measurement.

Copenhagen, Denmark DTU · CoaST Maritime Test Centre Scroll

Every ship grows a living layer on its hull. Barnacles, algae, and slime add drag and burn fuel. The coatings that resist them are tested on panels at sea, and for years that was judged by eye. My PhD rebuilt that judgement as a measurement, running as one connected pipeline.

A ship hull at the waterline, where marine biofouling takes hold
The problem — fouling on a working hull Drag · fuel · emissions

The PhD thesis pipeline

01

Stage one

Cameras underwater

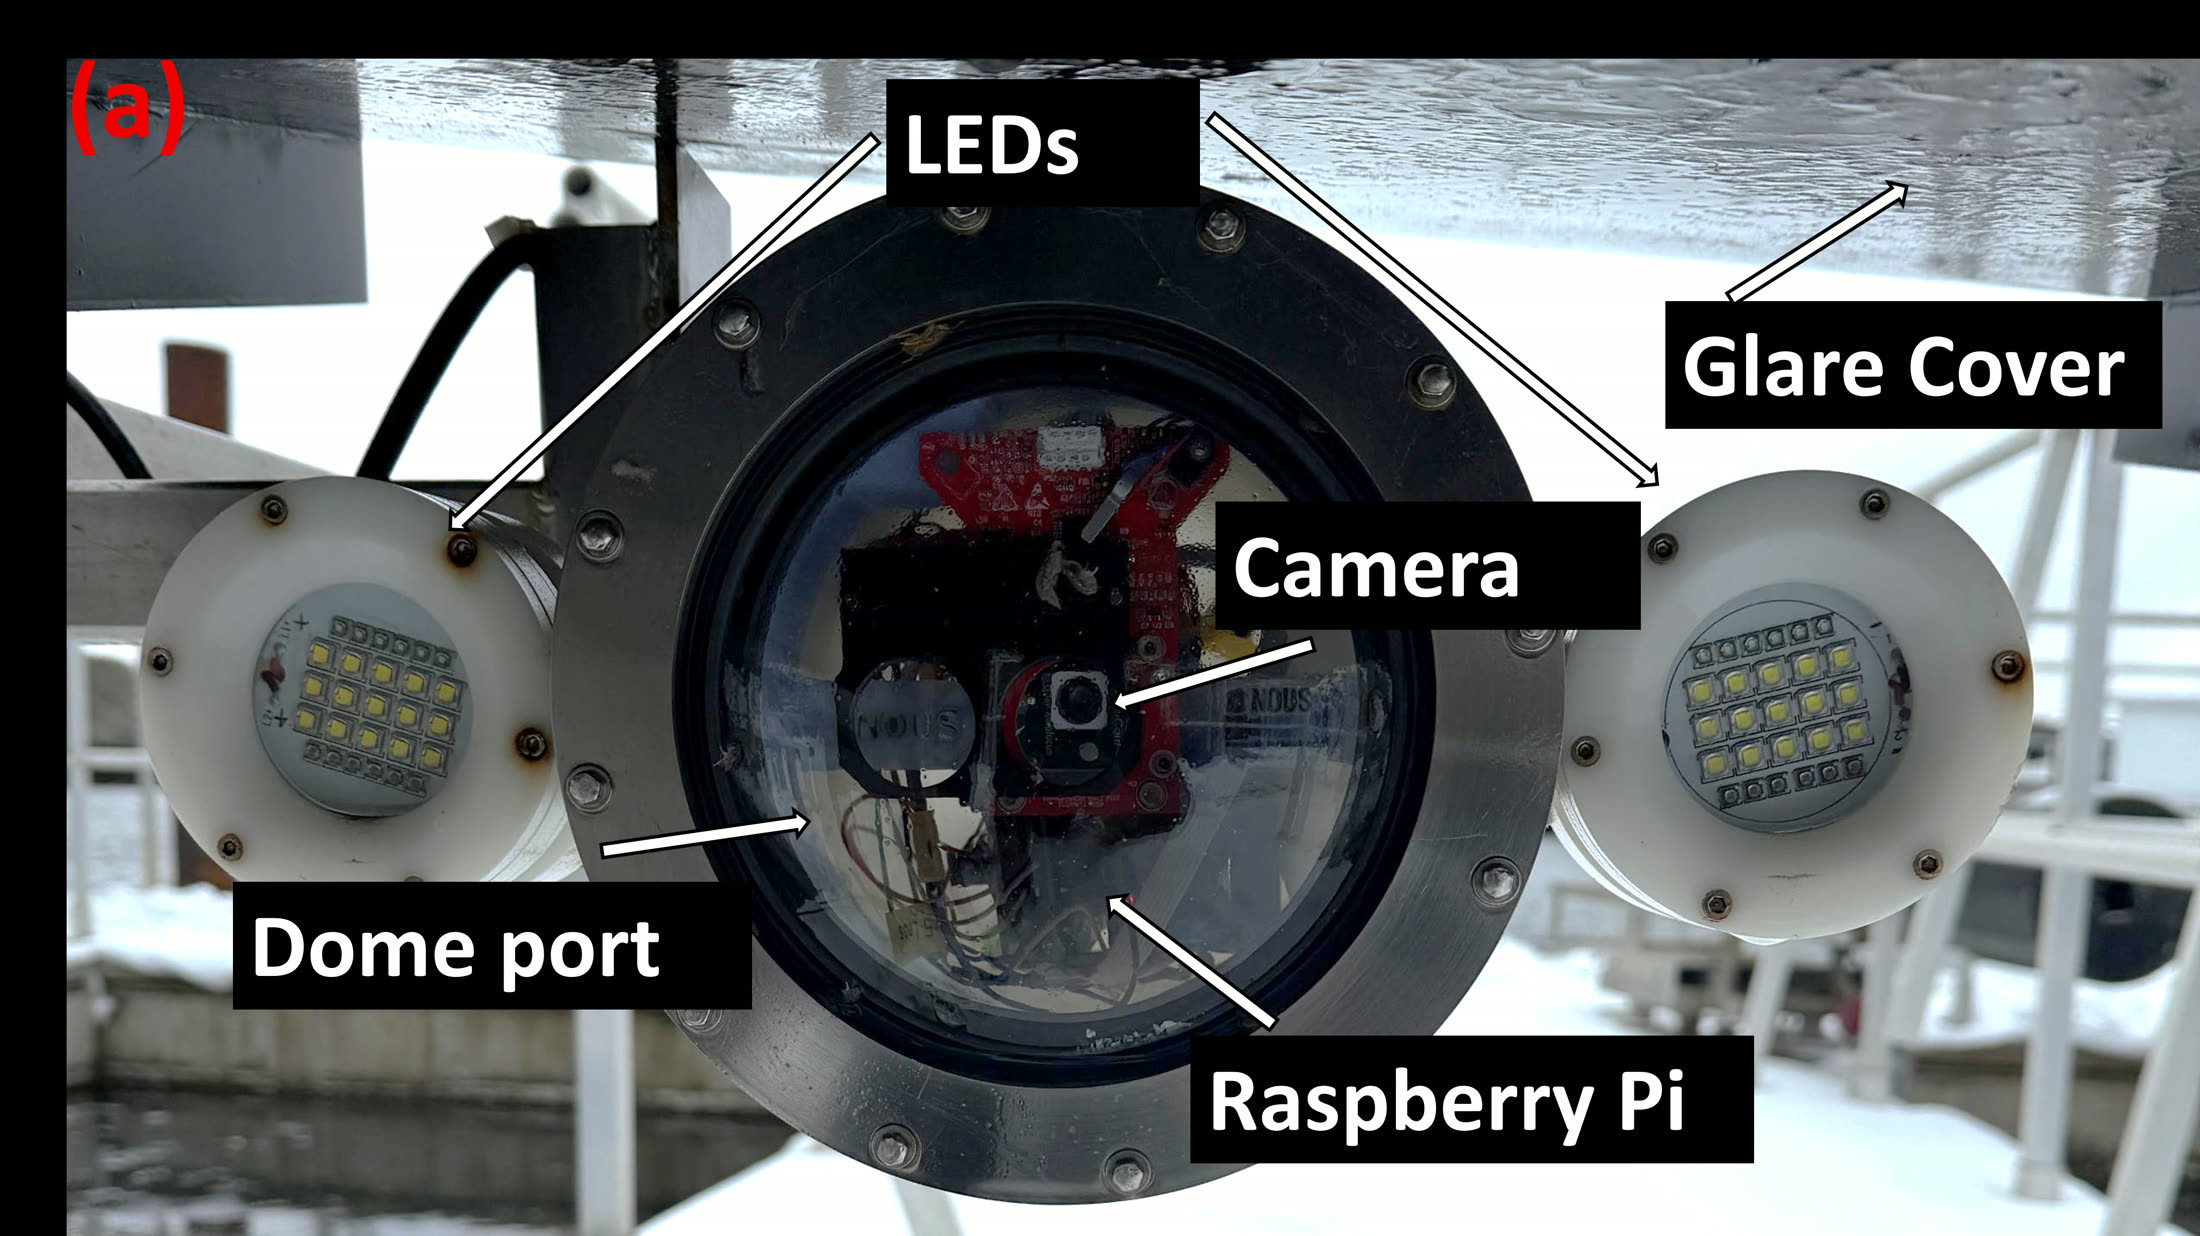
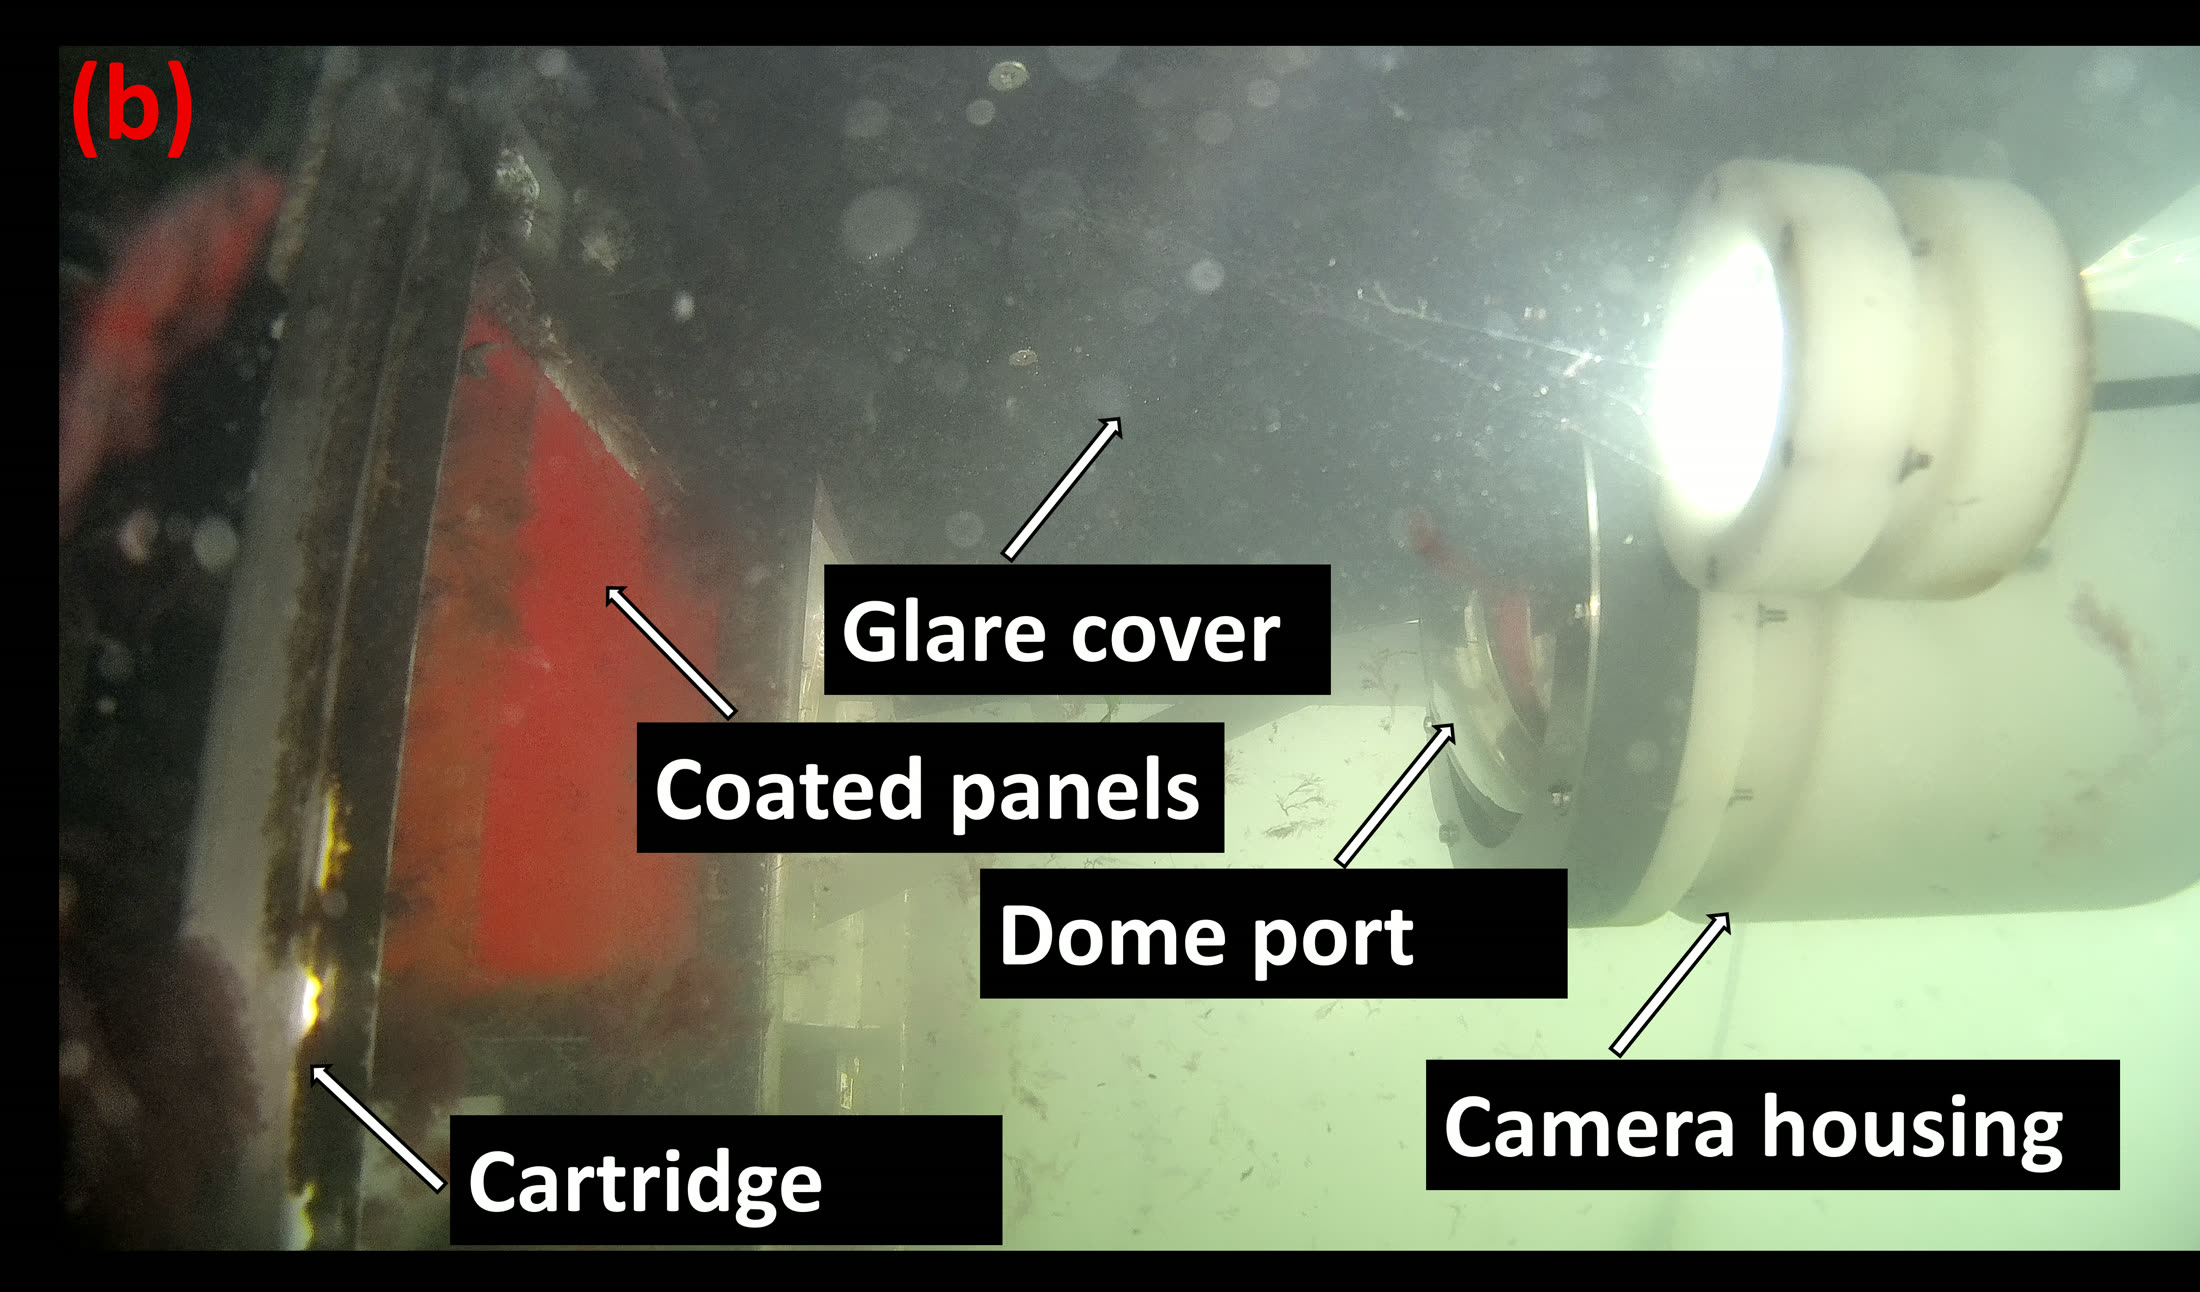
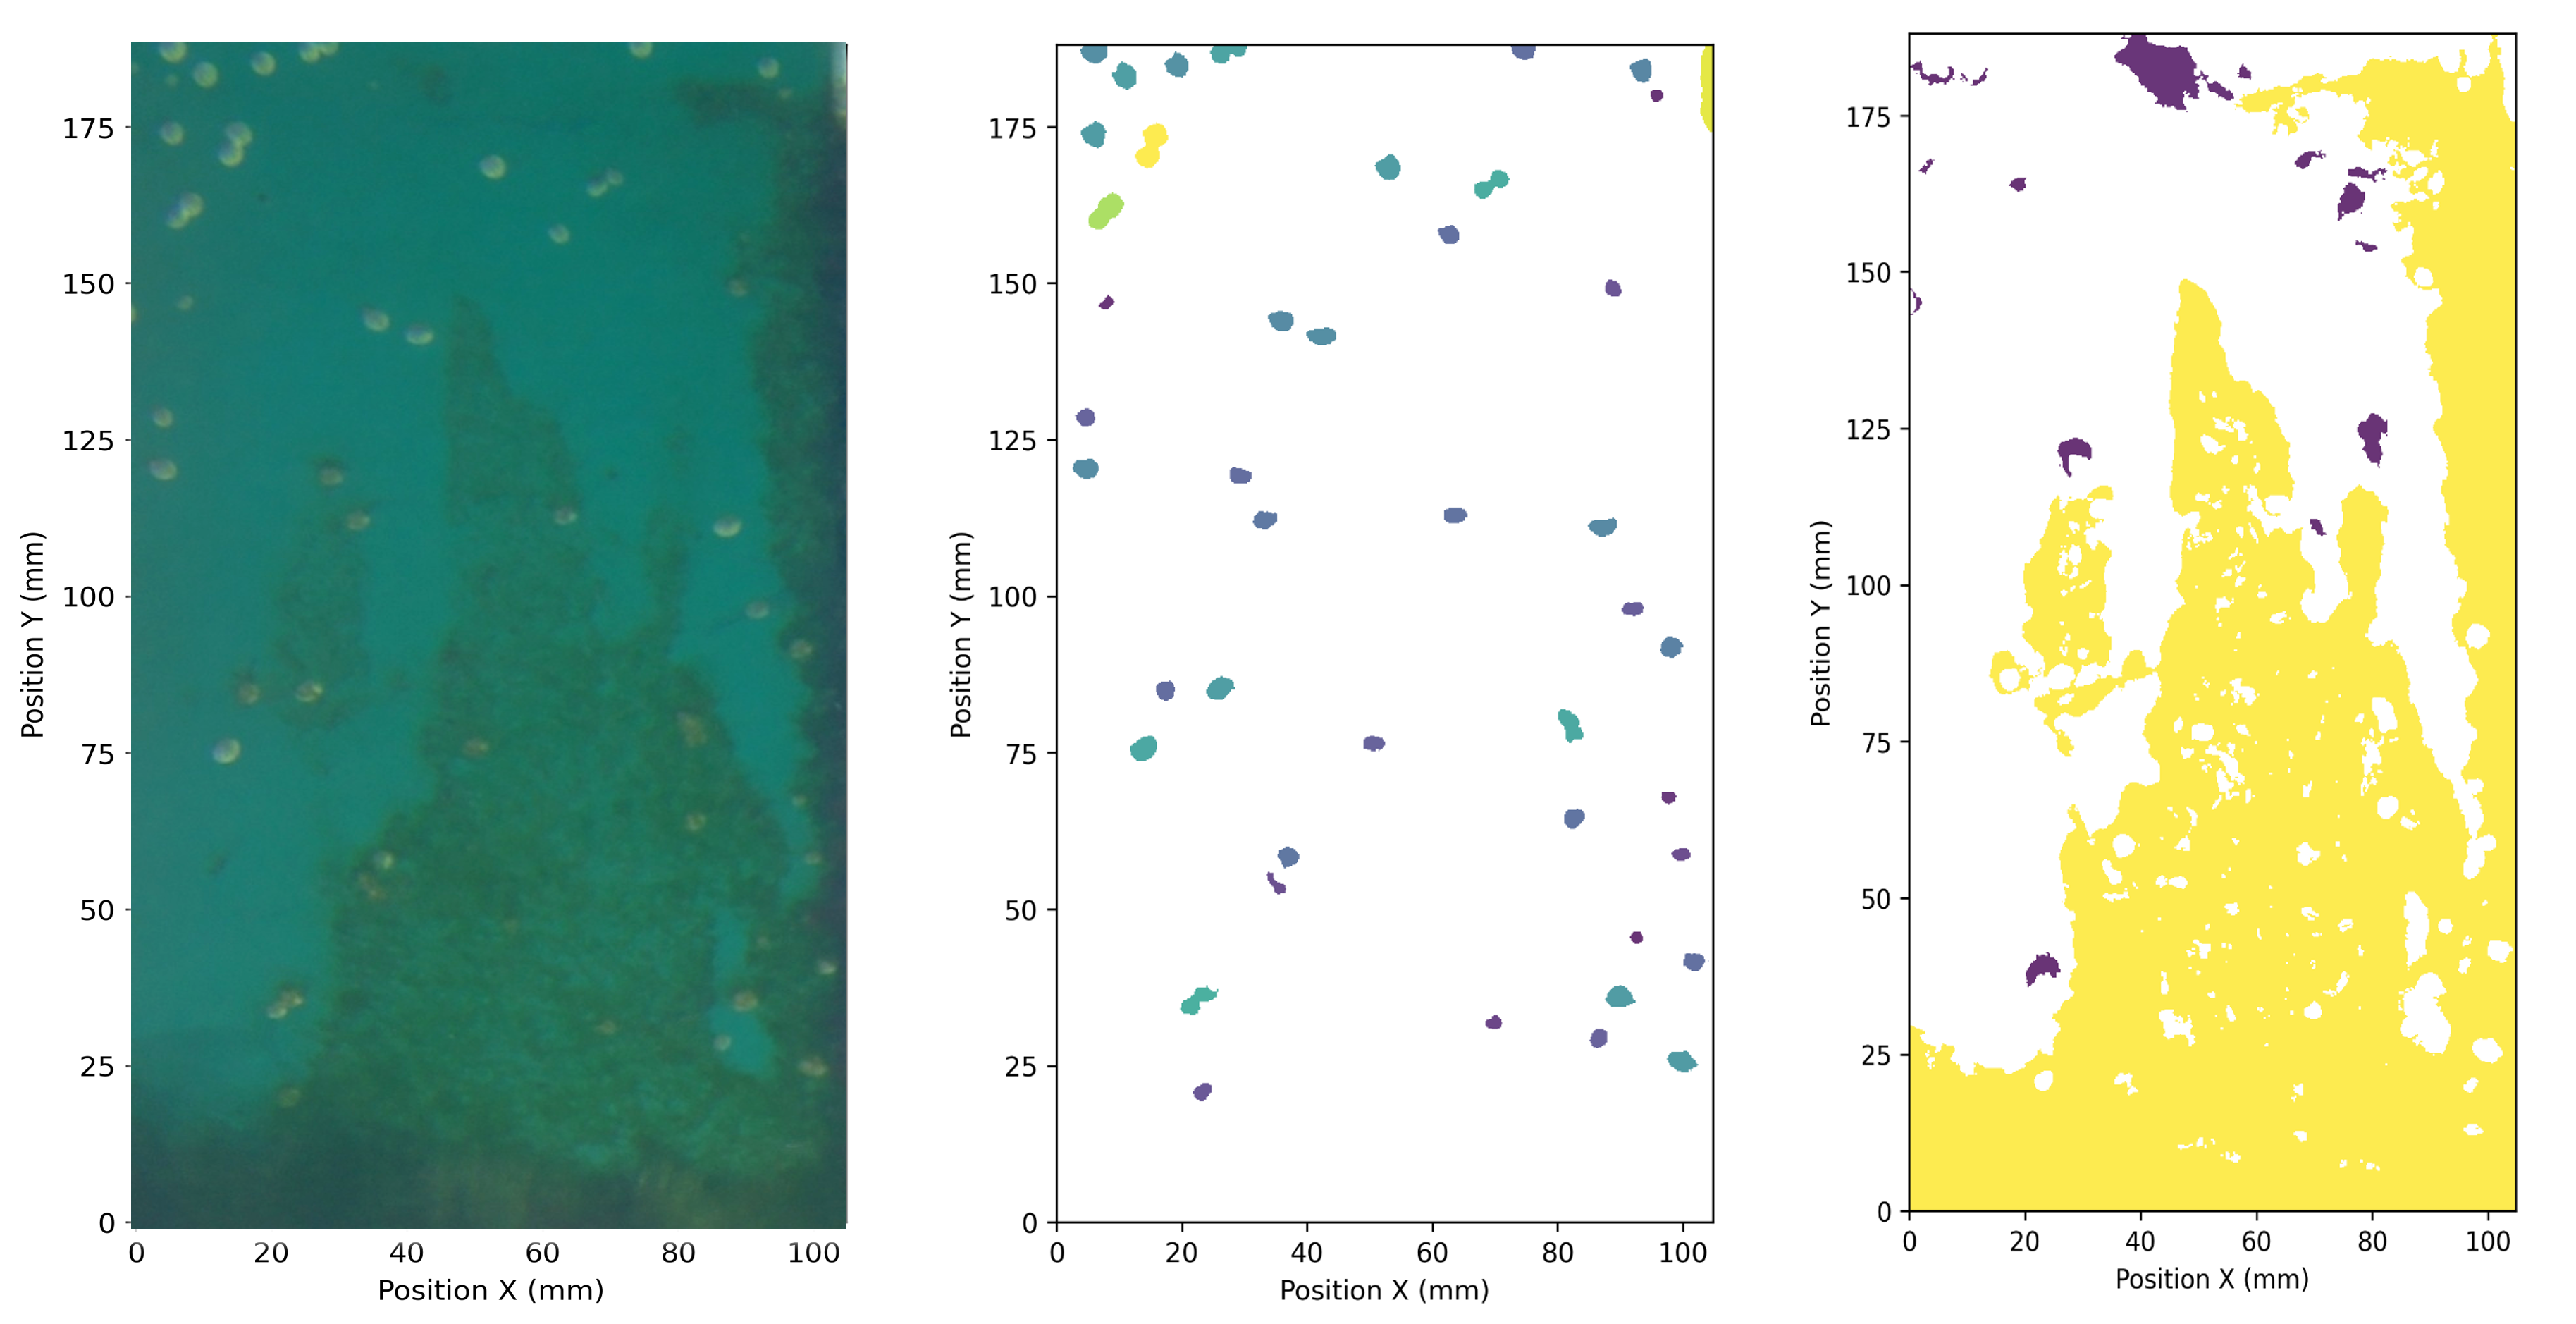
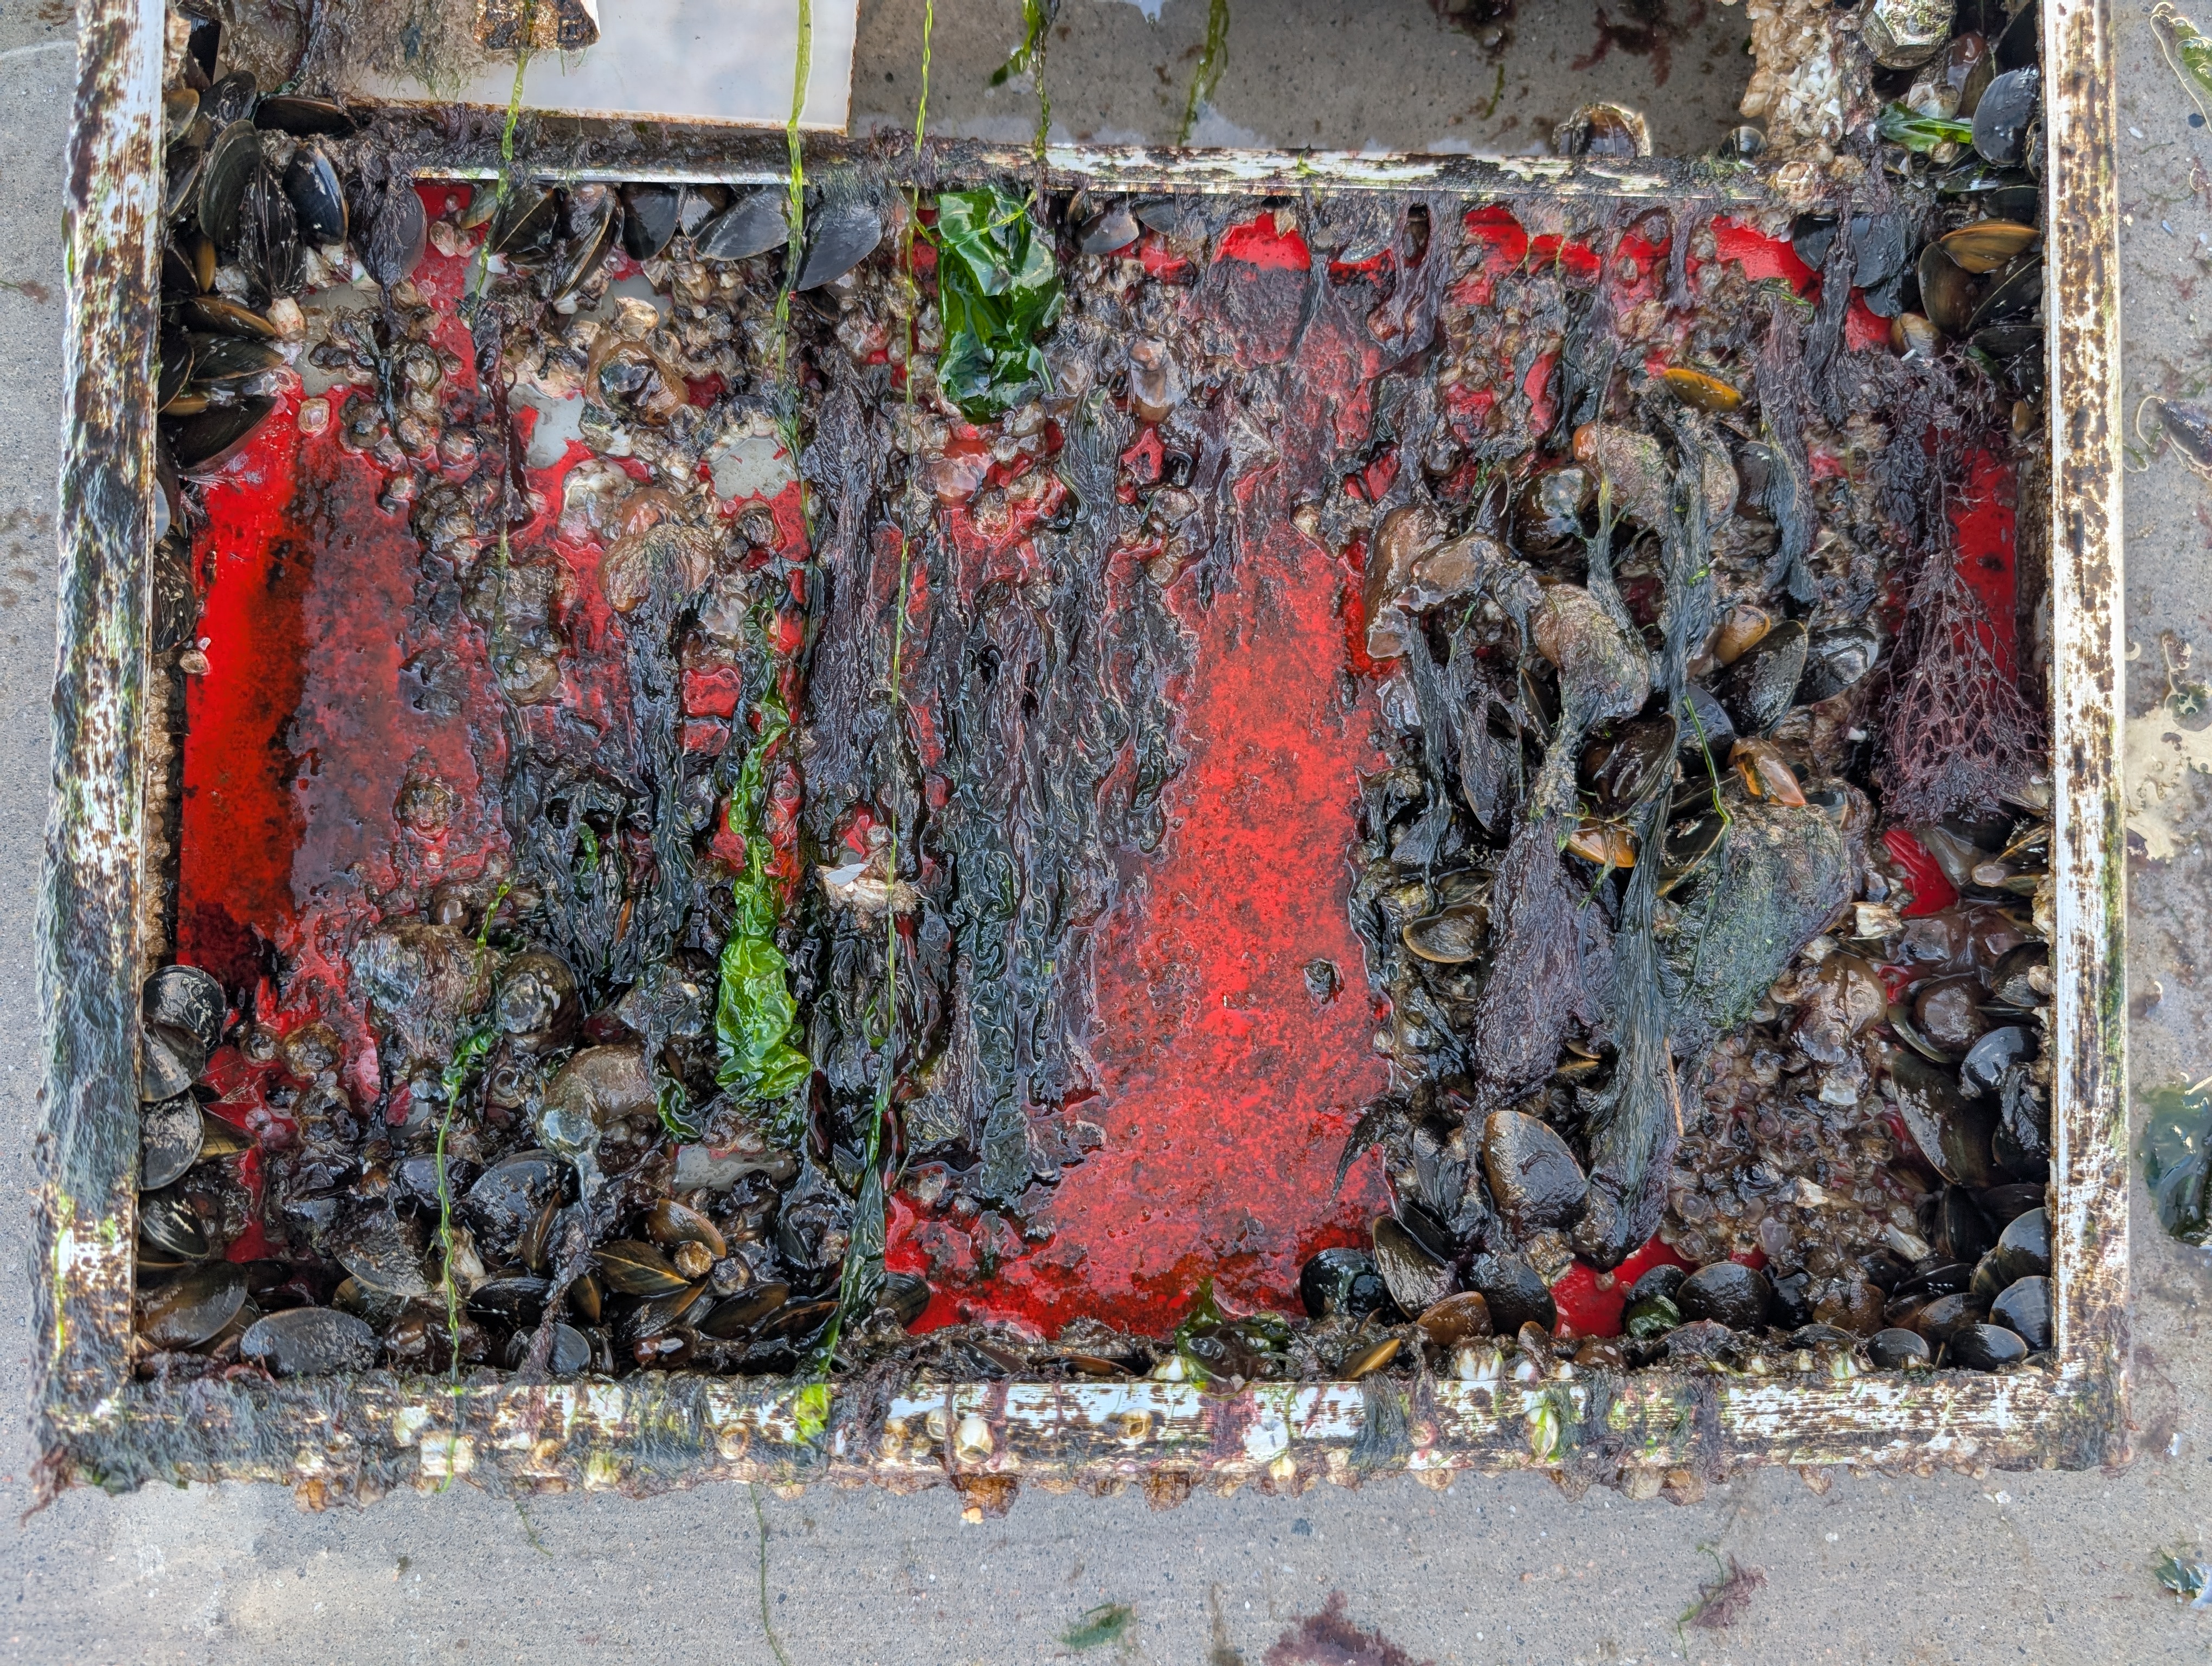
The pipeline starts with seeing clearly underwater. I selected and integrated the cameras, optics, and lighting, calibrated them against a submerged target, and built the housings that hold each panel in a fixed position. Three systems have run continuously for more than two years, and have become the standard imaging equipment the test centre relies on.

  • Camera integration
  • Optics & calibration
  • OpenCV
  • Field instrumentation
Imaging system on the dock
Camera housing submerged in the water
Camera housing submerged
02

Stage two

Autonomous field operation

Cameras are only useful when they keep running on their own. Each system is a Raspberry Pi in a sealed enclosure, capturing on a schedule, switching its own lights, and cleaning its own lens. I packaged the software in Docker, deployed it with a GitLab pipeline that ships to each device automatically, and wired everything to PostgreSQL databases and live dashboards.

  • Raspberry Pi
  • Docker
  • GitLab CI/CD
  • PostgreSQL
  • Dashboards
coast-edge-01 · live
  • camera-capturerunning
  • image-pipelinerunning
  • postgreshealthy
  • deploygitlab-ci → main → device
03

Stage three

Image processing

A raw underwater frame is murky, unevenly lit, and full of passing fish and debris. Before anything can be measured, the image has to be cleaned. I built the processing that returns a sharp, evenly lit, geometry corrected picture of each panel, stacking frames to remove drifting particles and fusing exposures for even light.

  • Raw & Bayer processing
  • Frame stacking
  • Exposure fusion
  • Geometry correction
Frame with fish and debris, before cleanup The same frame cleaned BeforeAfter
The same frame, debris removed
04

Stage four

Automatic panel identification

A single frame can hold several panels, so before any fouling is measured each panel has to be found and labelled on its own. A detection model locates every panel in the image and gives it a consistent identity, so the right measurement stays attached to the right panel across the whole record.

  • Object detection
  • YOLO detection
  • Panel indexing
Each panel located and identified
05

Stage five

Barnacle settlement and algae growth

With each panel identified, the models read its surface and measure what has grown on it, separating clean paint from algae and from animal settlement such as barnacles, consistently across every paint colour. The work is openly published with its data and code.

  • PyTorch
  • U-Net segmentation
  • XGBoost
  • Open data
Panel split into clean paint, algae, animals
Coated panel, segmented barnacles, algae
Algae and barnacle time series
Marine biofouling evaluation
06

Stage six

Dynamic biofouling evaluation

The last stage follows panels in motion. On a rotating test rig the same identification and measurement run on panels as they move through the water, which brings the assessment closer to the conditions a real hull experiences and supports dynamic evaluation of how a coating performs in service.

  • In-situ tracking
  • Object detection
  • Dynamic evaluation
Panels tracked in situ on the rotating rig